Make leaving
home worth it.
Work, managed living and everyday essentials, connected through Nia.

A simpler way to build a life away from home.
Three connected parts. One Nia membership.
One membership.
Wherever work takes you.
A job is the start. What happens around it helps determine whether the move pays off. Nia operates the support around working life, bringing employers, managed living and everyday services together.
A better start.
Find your next opportunity and discuss where you will live before the move.
Support around the job.
Settle into a managed Nest, with everyday needs closer to hand.
Something to build on.
Keep your Member relationship and record as your working life moves forward.
Your working life has a record.
NiaSave is the Member record that connects work, living and everyday life.
For enterprises
A stronger workforce starts before the shift.
Housing, meals and the move to a new place all shape working life. Bring these into your workforce plan with Nia. Start with your site, your people and the challenges you need to solve.
Discuss your workforce needsSee the enterprise model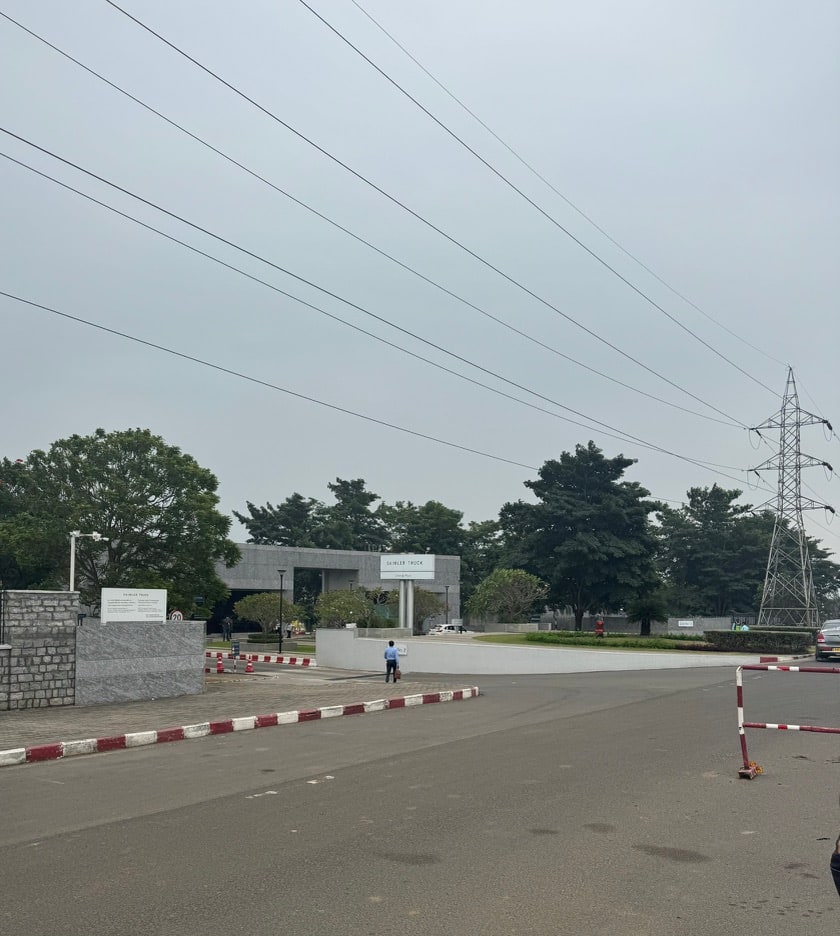
Built around
industrial corridors.
Work is not always where workers are born. Explore the locations where Nia connects work and managed living. Speak with the team about current availability and the right fit for your requirements.
Explore locationsFor investors and capital partners
Help build the places where working lives can grow.
Nia brings an operating business to the intersection of industrial employment, managed living and everyday demand. Explore the model, the work on the ground and the questions that will shape its next stage.
Explore the thesisStart an investor conversationInterested in a property partnership? Meet Nia as a Studio owner.
See the thinking.
Meet the people.
Explore Nia’s story, field notes and perspective on migration, working life and India’s industrial corridors.
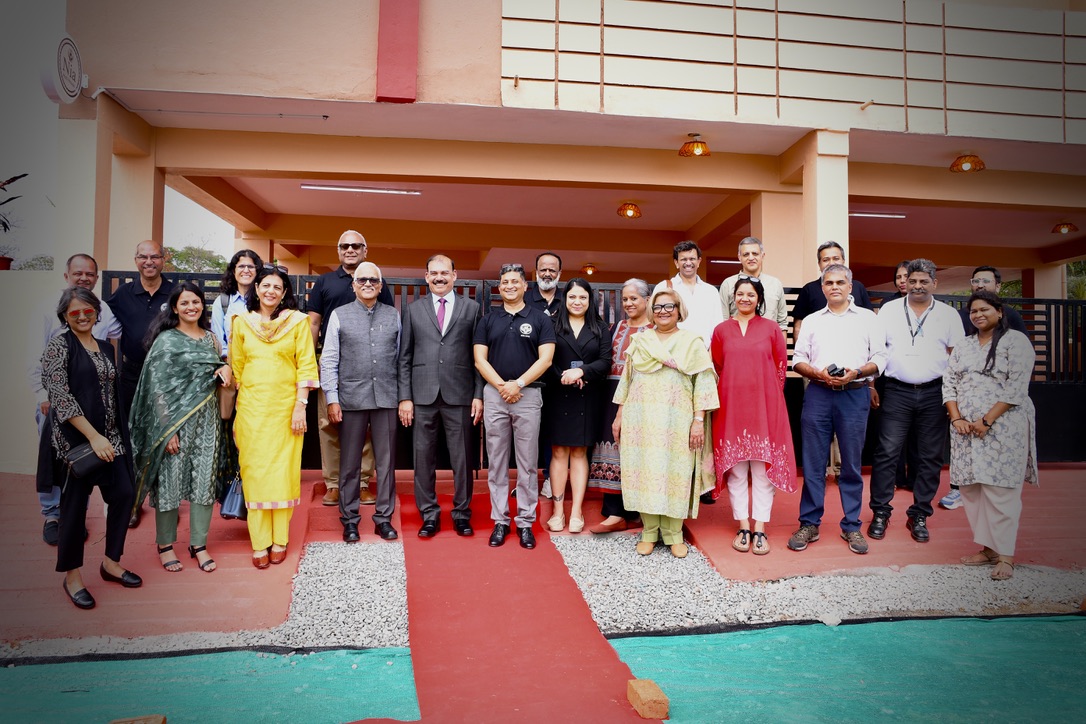
6 August 2026 · Oragadam
Women, Work and Development Collective.
Our first Śram Park for women came alive in the company of a small, insightful group.
Read the storyExplore Śram ParkBring everyday essentials closer.
Explore how brands and service partners can work with Nia.
The case for
continuity.
India’s industrial work and its future workforce are not always in the same places. That separation is the starting point for Nia: a move for work also means finding a place to live, meeting everyday needs and building a record that can travel with the worker.
The national migration rate was 28.9% in 2020–21, according to MoSPI. Factory-employment data and research on structural change help explain why Nia looks at industrial corridors as connected systems. These are the sources behind the thesis, not claims about Nia’s own operating results.
Read the evidence behind the modelGood questions.
Clear answers.
Talk to the teamWhat does Nia do?
Nia connects work, managed living and everyday essentials for migrant workers, and operates the services around that model.
How can an enterprise work with Nia?
Share your site location, workforce requirements and timing with the team to discuss a suitable scope.
Can property owners partner with Nia?
Yes. Contact Nia to discuss whether your property fits the managed-living model. Suitability and partnership terms are assessed for each property.
How do I speak with Nia about investment?
Send an investor enquiry through the contact page. Tell us whether your interest is in the operating business or a property and development partnership.
How do workers join?
Workers can speak with Nia on WhatsApp, or through an employer that partners with Nia, to discuss membership, work and managed-living availability.
Make the next move count.
For the worker building a life. For the enterprise building a team. For the partners helping make it possible.
Talk to Nia